Turn your Jupyter Notebook into interactive Presentation Slides
This is demo. If you're looking for a more detailed understanding and want to follow along step by step with thorough explanations, we highly recommend you to read our article below:
👉 Slide type of this cell: Slide
Data pre-processing
The code provided in this section represents the pre-processing steps that were explained in our first lesson about data cleaning.
# 👉 Slide type of this cell: Fragement
import pandas as pd
# change the filepath according to your file location
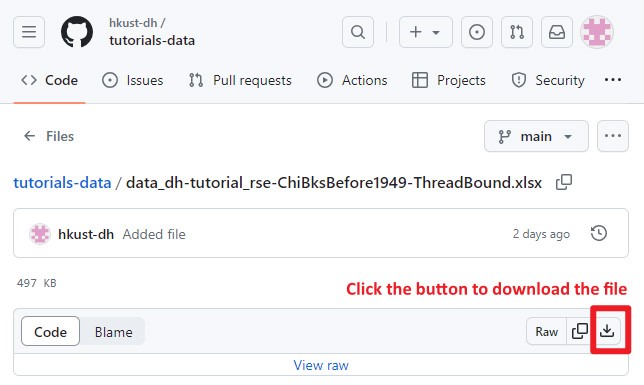
# Download the Excel here: https://bit.ly/hkust-dh-github-data-threadbound
# Save the file to the same folder of this Jupyter Notebook
filepath = 'data_dh-tutorial_rse-ChiBksBefore1949-ThreadBound.xlsx'
# read data from Excel file
data = pd.read_excel(filepath, sheet_name='data')
# make a copy of the original dataframe "data", and named the copy as "data2"
data2 = data.copy()
# rename column name - from "year published" to "year"
data2.rename(columns={'year published':'year'}, inplace=True)
# group the individual years into broader time periods
data2['Period'] = ['16th century' if 1501 <= year <= 1600 else '17th century' if 1601 <= year <= 1700 else '18th century' if 1701 <= year <= 1800 else '19th century' if 1801 <= year <= 1900 else '20th century' if 1901 <= year <= 2000 else "Ungrouped" for year in data2['year']]
👉 Slide type of this cell: Sub-Slide
Dataframe preview
# 👉 Slide type of this cell: Fragment
data2.info()
<class 'pandas.core.frame.DataFrame'>
RangeIndex: 106 entries, 0 to 105
Data columns (total 3 columns):
 #   Column           Non-Null Count  Dtype
---  ------           --------------  -----
 0   year             106 non-null    int64
 1   number of items  106 non-null    int64
 2   Period           106 non-null    object
dtypes: int64(2), object(1)
memory usage: 2.6+ KB
# 👉 Slide type of this cell: Sub-Slide
data2
| year | number of items | Period | |
|---|---|---|---|
| 0 | 1600 | 1 | 16th century |
| 1 | 1655 | 1 | 17th century |
| 2 | 1705 | 1 | 18th century |
| 3 | 1709 | 1 | 18th century |
| 4 | 1748 | 1 | 18th century |
| 5 | 1749 | 1 | 18th century |
| 6 | 1781 | 1 | 18th century |
| 7 | 1786 | 1 | 18th century |
| 8 | 1795 | 1 | 18th century |
| 9 | 1800 | 1 | 18th century |
| 10 | 1810 | 1 | 19th century |
| 11 | 1813 | 1 | 19th century |
| 12 | 1817 | 1 | 19th century |
| 13 | 1821 | 1 | 19th century |
| 14 | 1828 | 1 | 19th century |
| 15 | 1832 | 1 | 19th century |
| 16 | 1838 | 1 | 19th century |
| 17 | 1844 | 1 | 19th century |
| 18 | 1845 | 1 | 19th century |
| 19 | 1846 | 2 | 19th century |
| 20 | 1847 | 1 | 19th century |
| 21 | 1848 | 1 | 19th century |
| 22 | 1849 | 2 | 19th century |
| 23 | 1850 | 2 | 19th century |
| 24 | 1851 | 4 | 19th century |
| 25 | 1852 | 1 | 19th century |
| 26 | 1853 | 1 | 19th century |
| 27 | 1860 | 1 | 19th century |
| 28 | 1861 | 1 | 19th century |
| 29 | 1862 | 1 | 19th century |
| ... | ... | ... | ... |
| 76 | 1920 | 51 | 20th century |
| 77 | 1921 | 11 | 20th century |
| 78 | 1922 | 14 | 20th century |
| 79 | 1923 | 8 | 20th century |
| 80 | 1924 | 11 | 20th century |
| 81 | 1925 | 14 | 20th century |
| 82 | 1926 | 11 | 20th century |
| 83 | 1927 | 6 | 20th century |
| 84 | 1928 | 7 | 20th century |
| 85 | 1929 | 7 | 20th century |
| 86 | 1930 | 20 | 20th century |
| 87 | 1931 | 9 | 20th century |
| 88 | 1932 | 10 | 20th century |
| 89 | 1933 | 14 | 20th century |
| 90 | 1934 | 16 | 20th century |
| 91 | 1935 | 17 | 20th century |
| 92 | 1936 | 24 | 20th century |
| 93 | 1937 | 9 | 20th century |
| 94 | 1938 | 4 | 20th century |
| 95 | 1939 | 6 | 20th century |
| 96 | 1940 | 13 | 20th century |
| 97 | 1941 | 7 | 20th century |
| 98 | 1942 | 6 | 20th century |
| 99 | 1943 | 4 | 20th century |
| 100 | 1944 | 7 | 20th century |
| 101 | 1945 | 10 | 20th century |
| 102 | 1946 | 4 | 20th century |
| 103 | 1947 | 5 | 20th century |
| 104 | 1948 | 6 | 20th century |
| 105 | 1949 | 3 | 20th century |
👉 Slide type of this cell: Slide
Data Visualization
👉 Slide type of this cell: Slide
Plotly chart - example
👉 Slide type of this cell: Slide
Plotly chart - another example
HKUST Digital Humanities Initiative
Let's read our article below. We will walk you through the steps of converting Jupyter Notebook to an interactive presentation slide. https://digitalhumanities.hkust.edu.hk/tutorials/turn-your-jupyter-notebook-into-interactive-presentation-slides-using-anaconda/
💬 Feel free to get in touch with us!
The HKUST Digital Humanities Initiative is a collaborative community aimed at bringing together faculty, library, and students to explore digital humanities skills and develop innovative digital projects. It bridges the gap between science and the humanities through digital methods and practices.